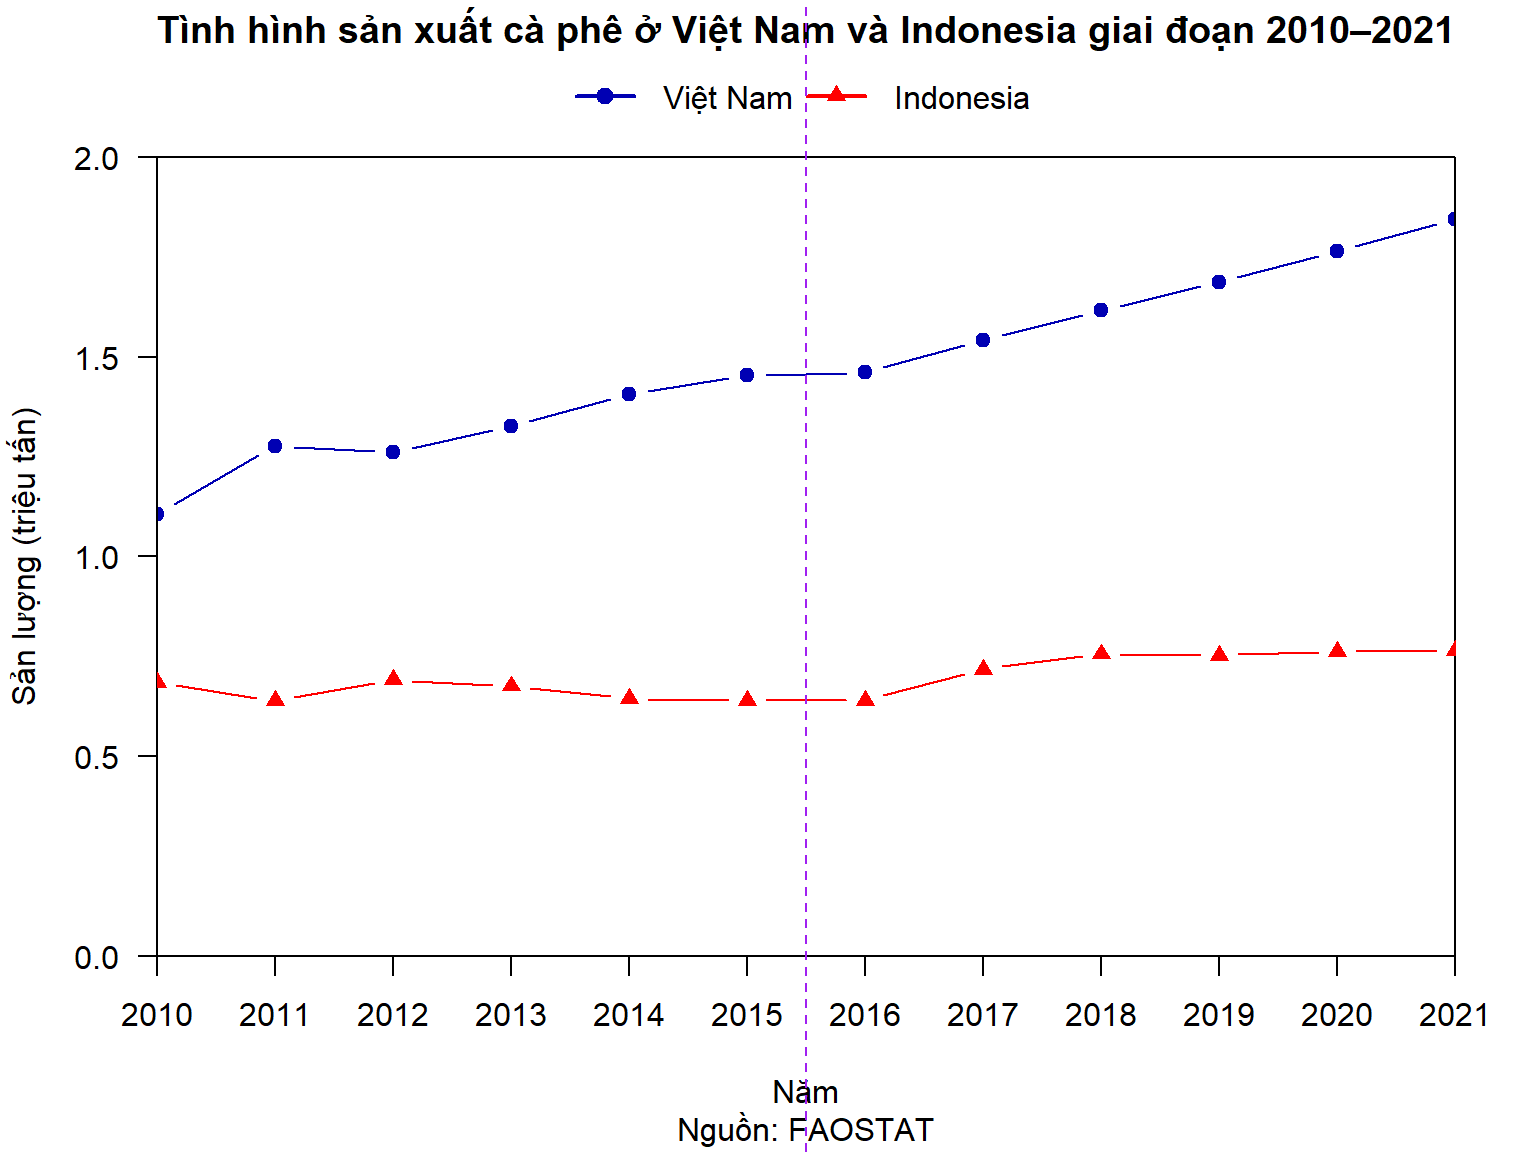
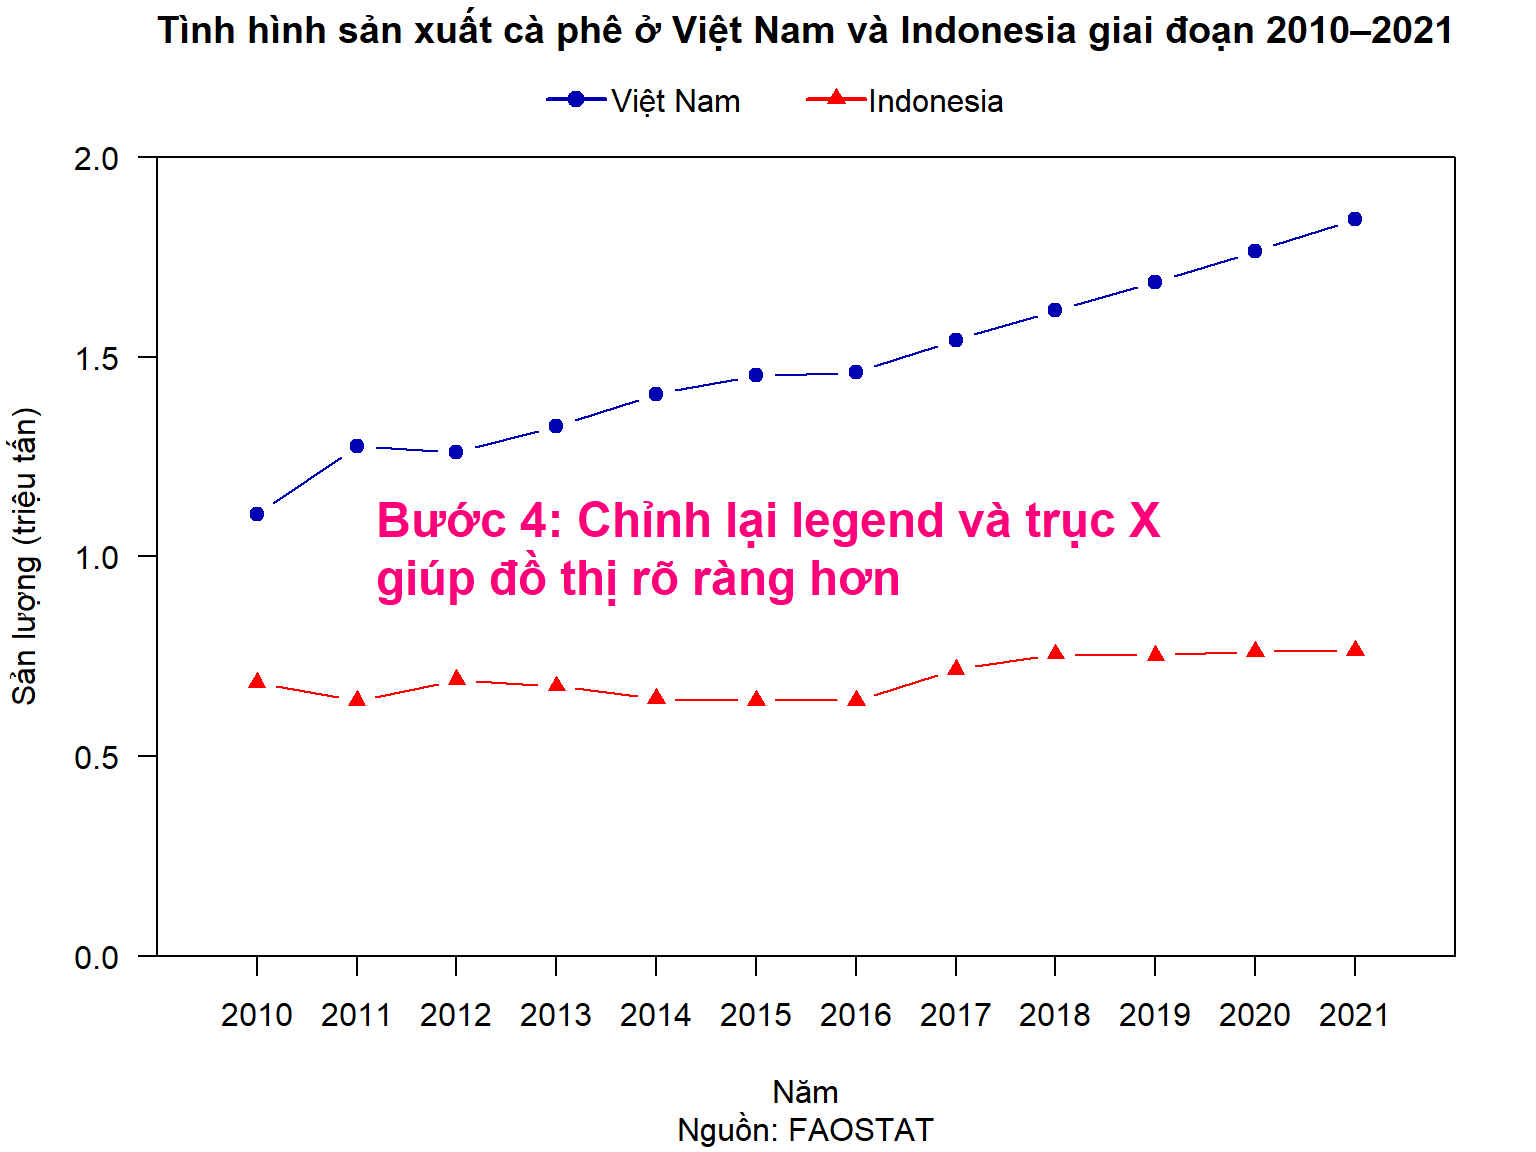
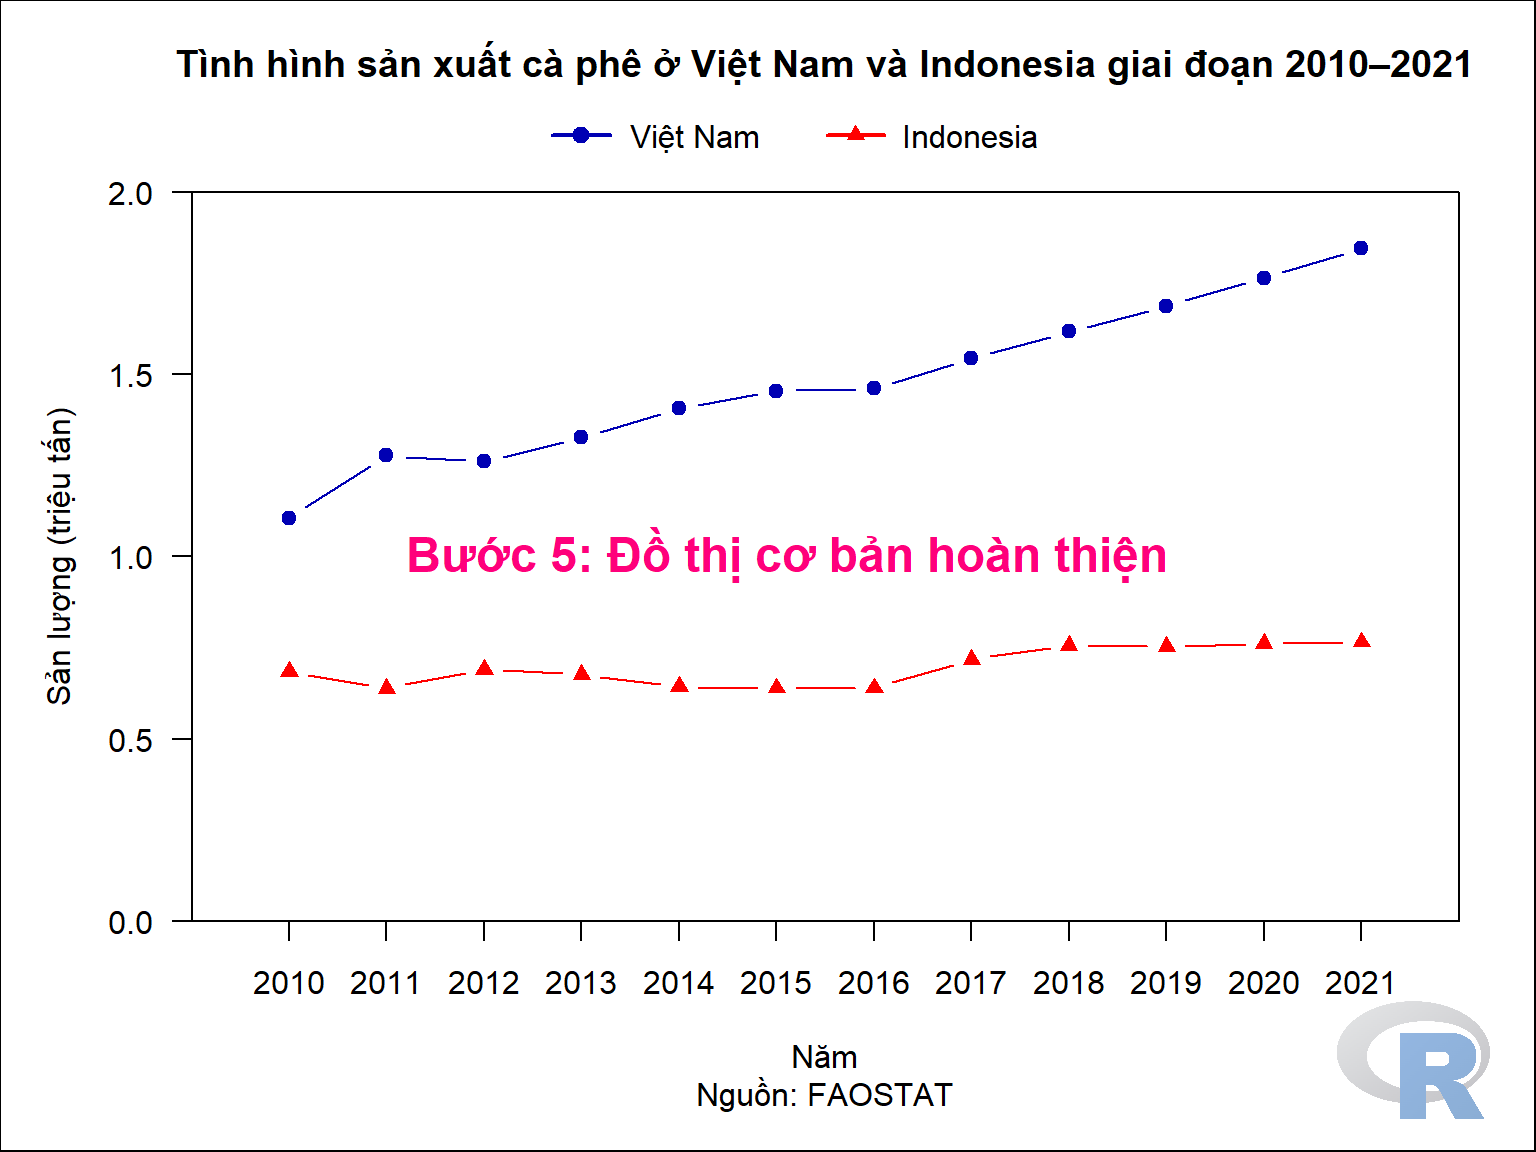
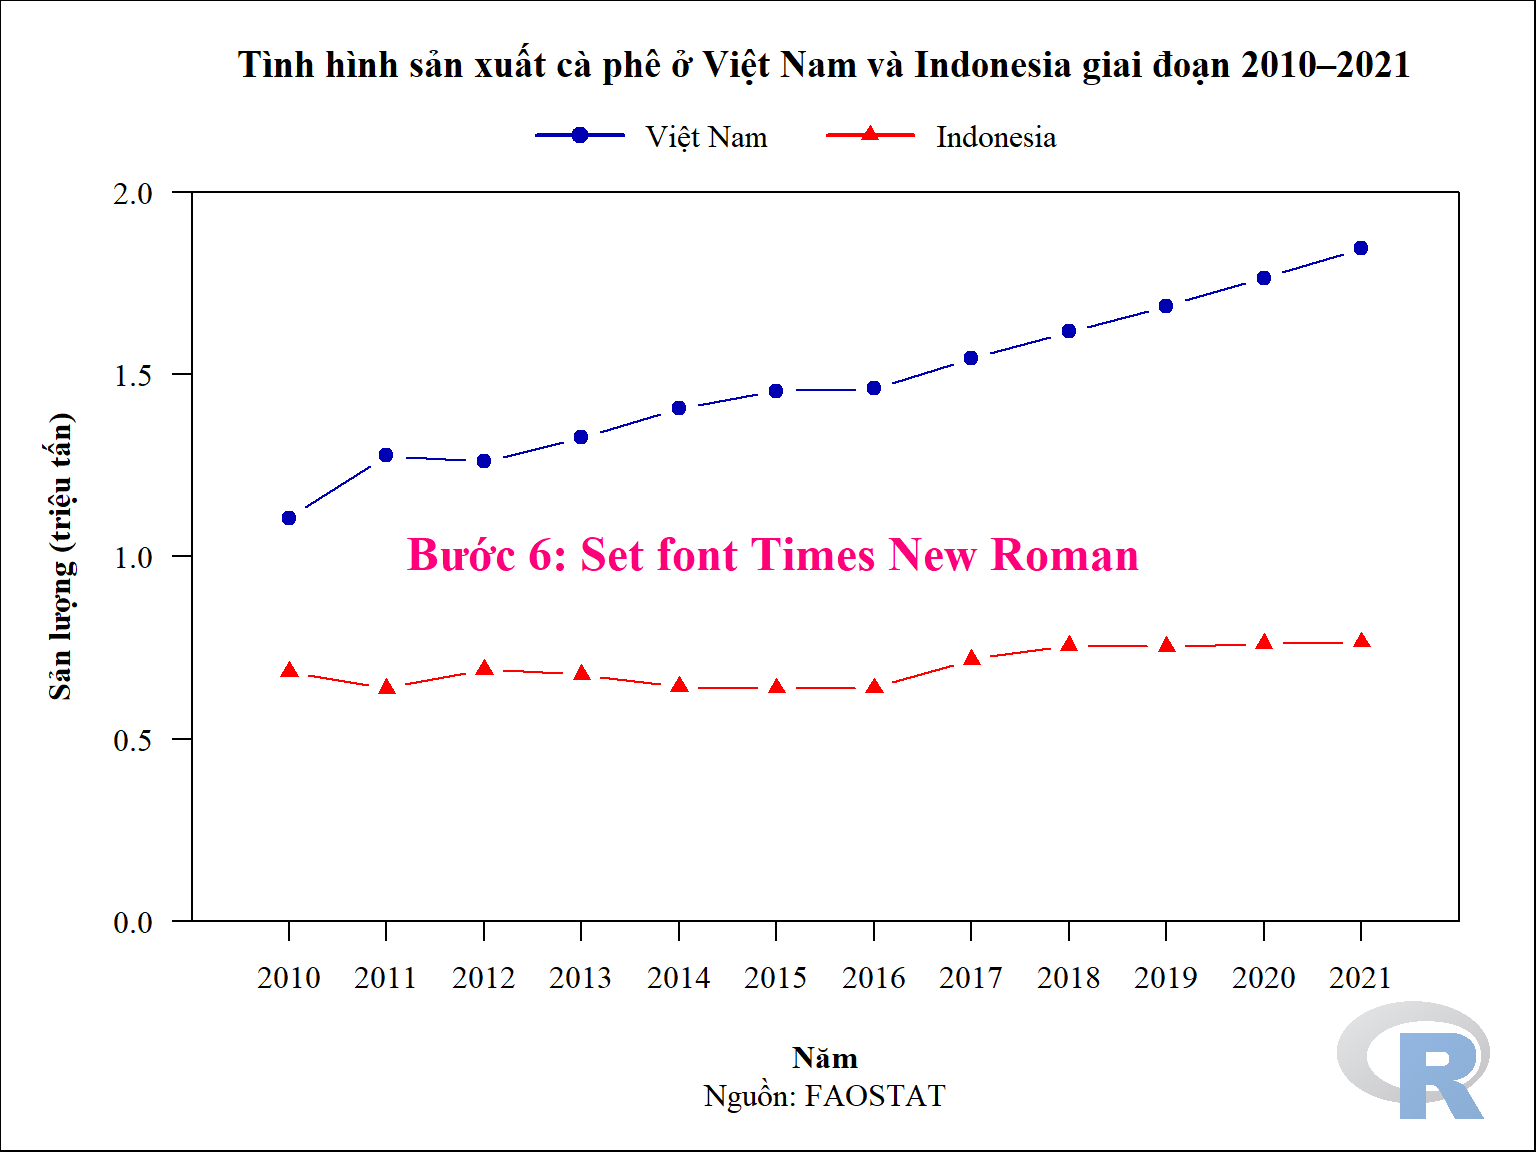
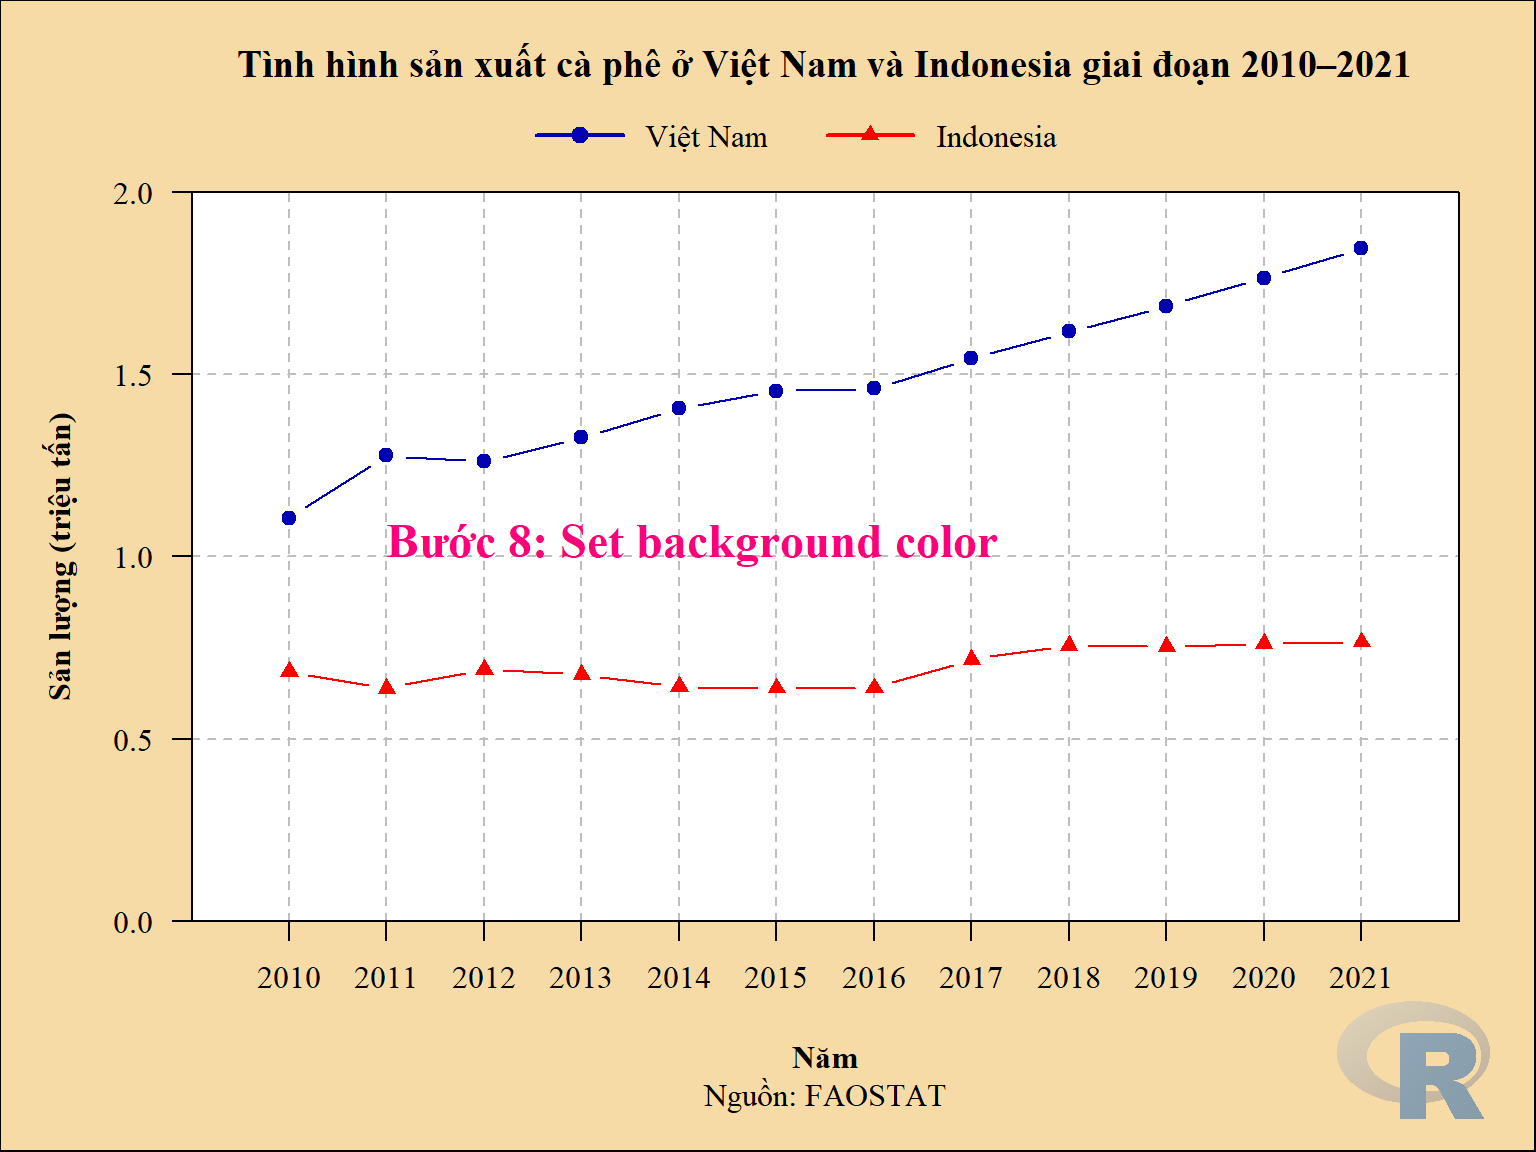
par(bg = "gray90")

par(mar = c(6, 5, 5, 2))

par(font.lab = 2)

windowsFonts(font_1 = windowsFont("Times New Roman"))

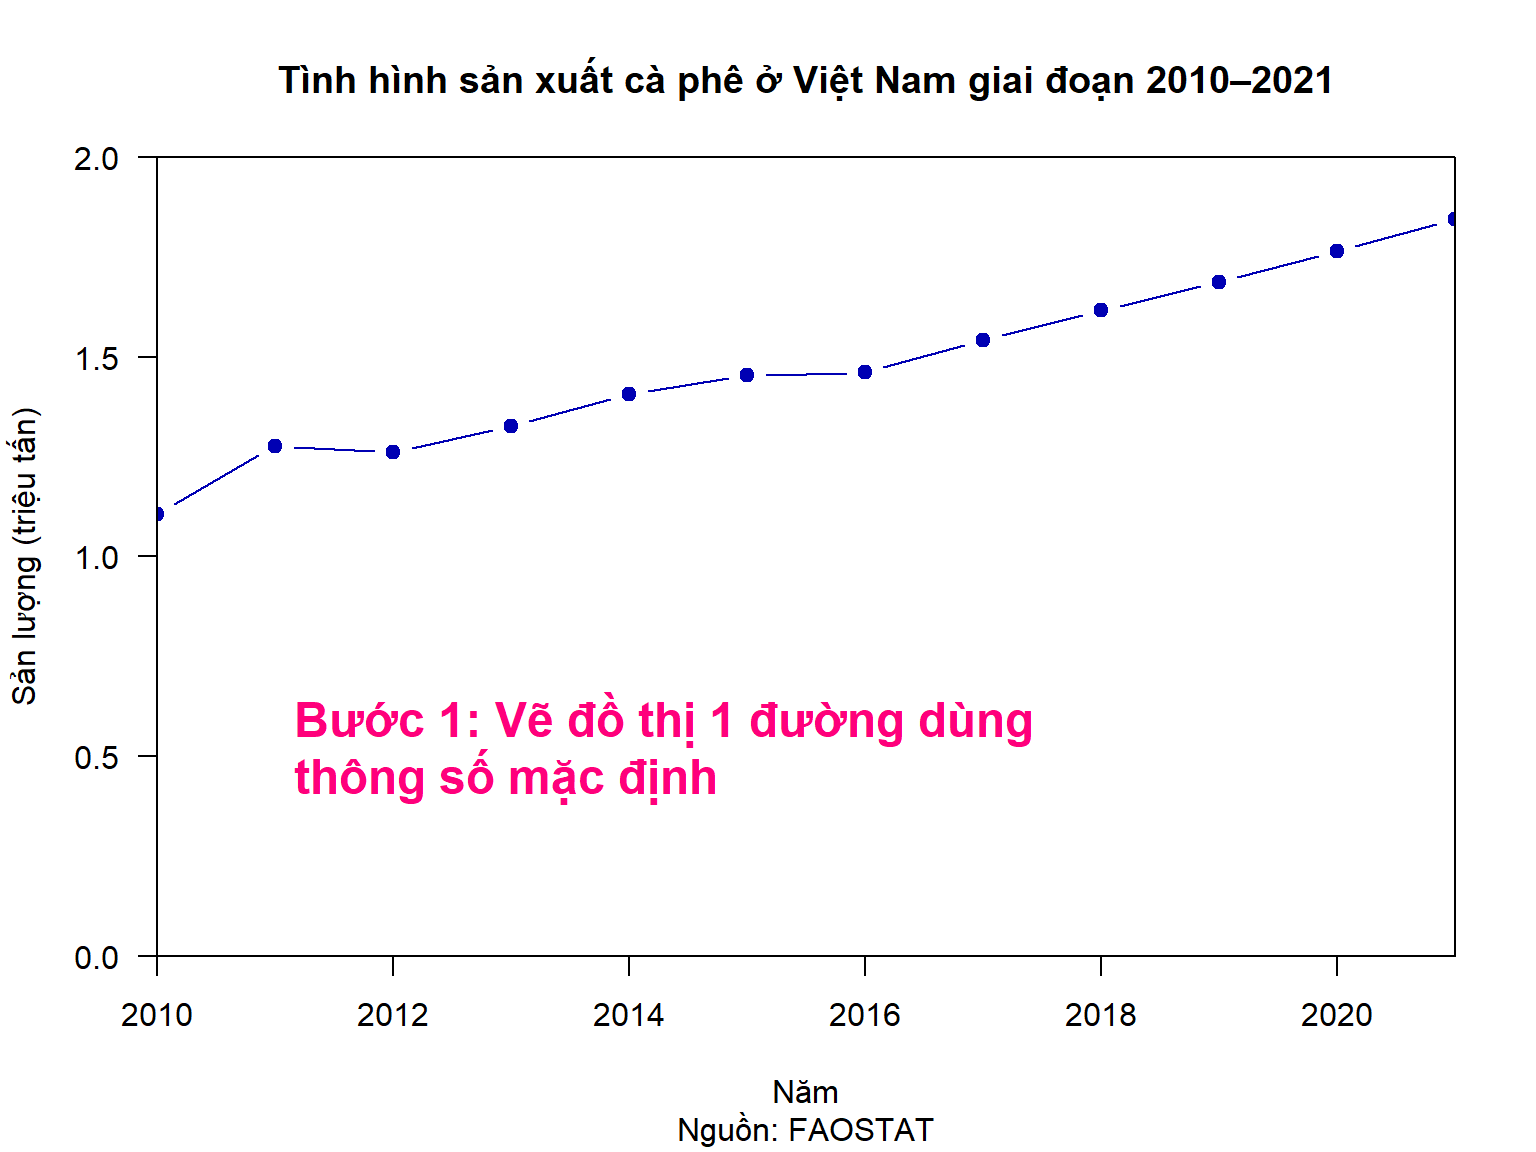
plot(production ~ year,
     data = coffee_vn_2010_2021,
     xaxs = "i",
     yaxs = "i",
     xlim = c(2009, 2022),
     ylim = c(0, 2),
     type = "n",
     xlab = "",
     ylab = "",
     xaxt = "n",
     yaxt = "n")

rect(par("usr")[1], par("usr")[3],
     par("usr")[2], par("usr")[4],
     col = "white")

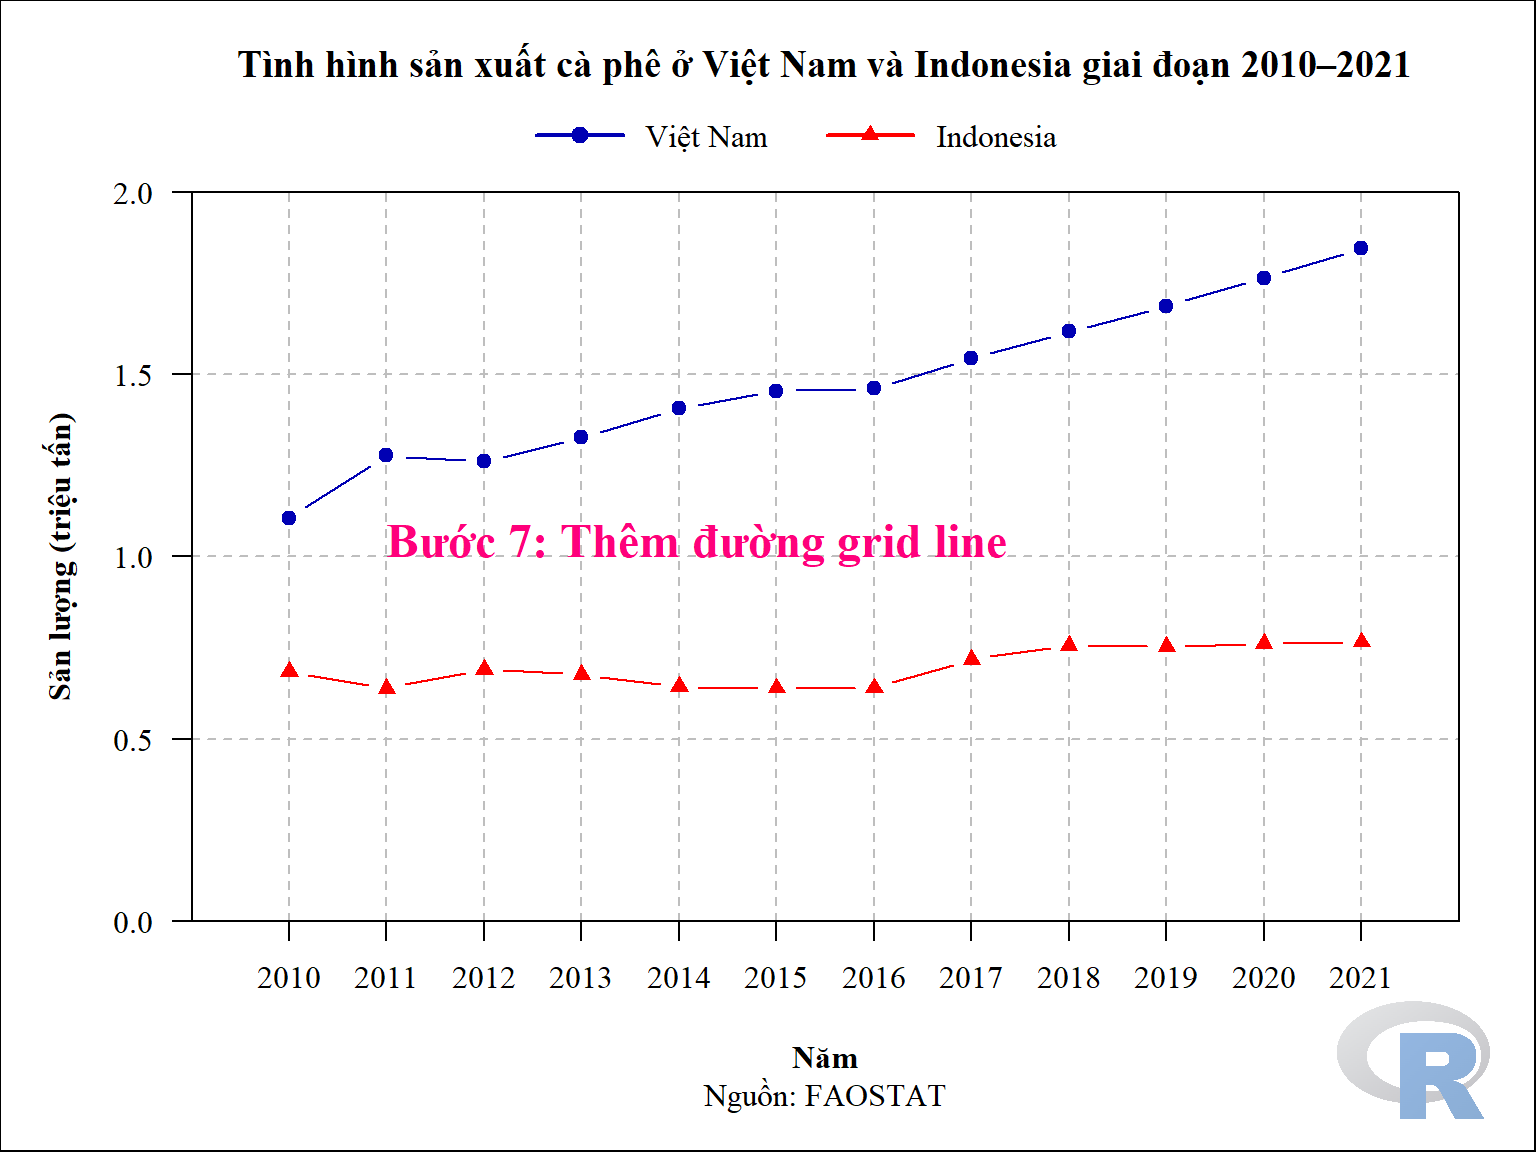
grid(nx = 13,
     ny = 4,
     lty = 2,
     col = "gray",
     lwd = 1)

par(new = TRUE) # make grid line behind the plot

plot(production ~ year,
     data = coffee_vn_2010_2021,
     family = "font_1",
     las = 1,
     xaxs = "i",
     yaxs = "i",
     col = "#0000b3",
     xlim = c(2009, 2022),
     ylim = c(0, 2),
     pch = 19,
     type = "b",
     xlab = "Năm",
     ylab = "Sản lượng (triệu tấn)",
     # main = "Tình hình sản xuất cà phê ở Việt Nam và Indonesia giai đoạn 2010–2021",
     sub = "Nguồn: FAOSTAT",
     xaxt = "n" # remove thông tin trục x
     # yaxt="n"
     )

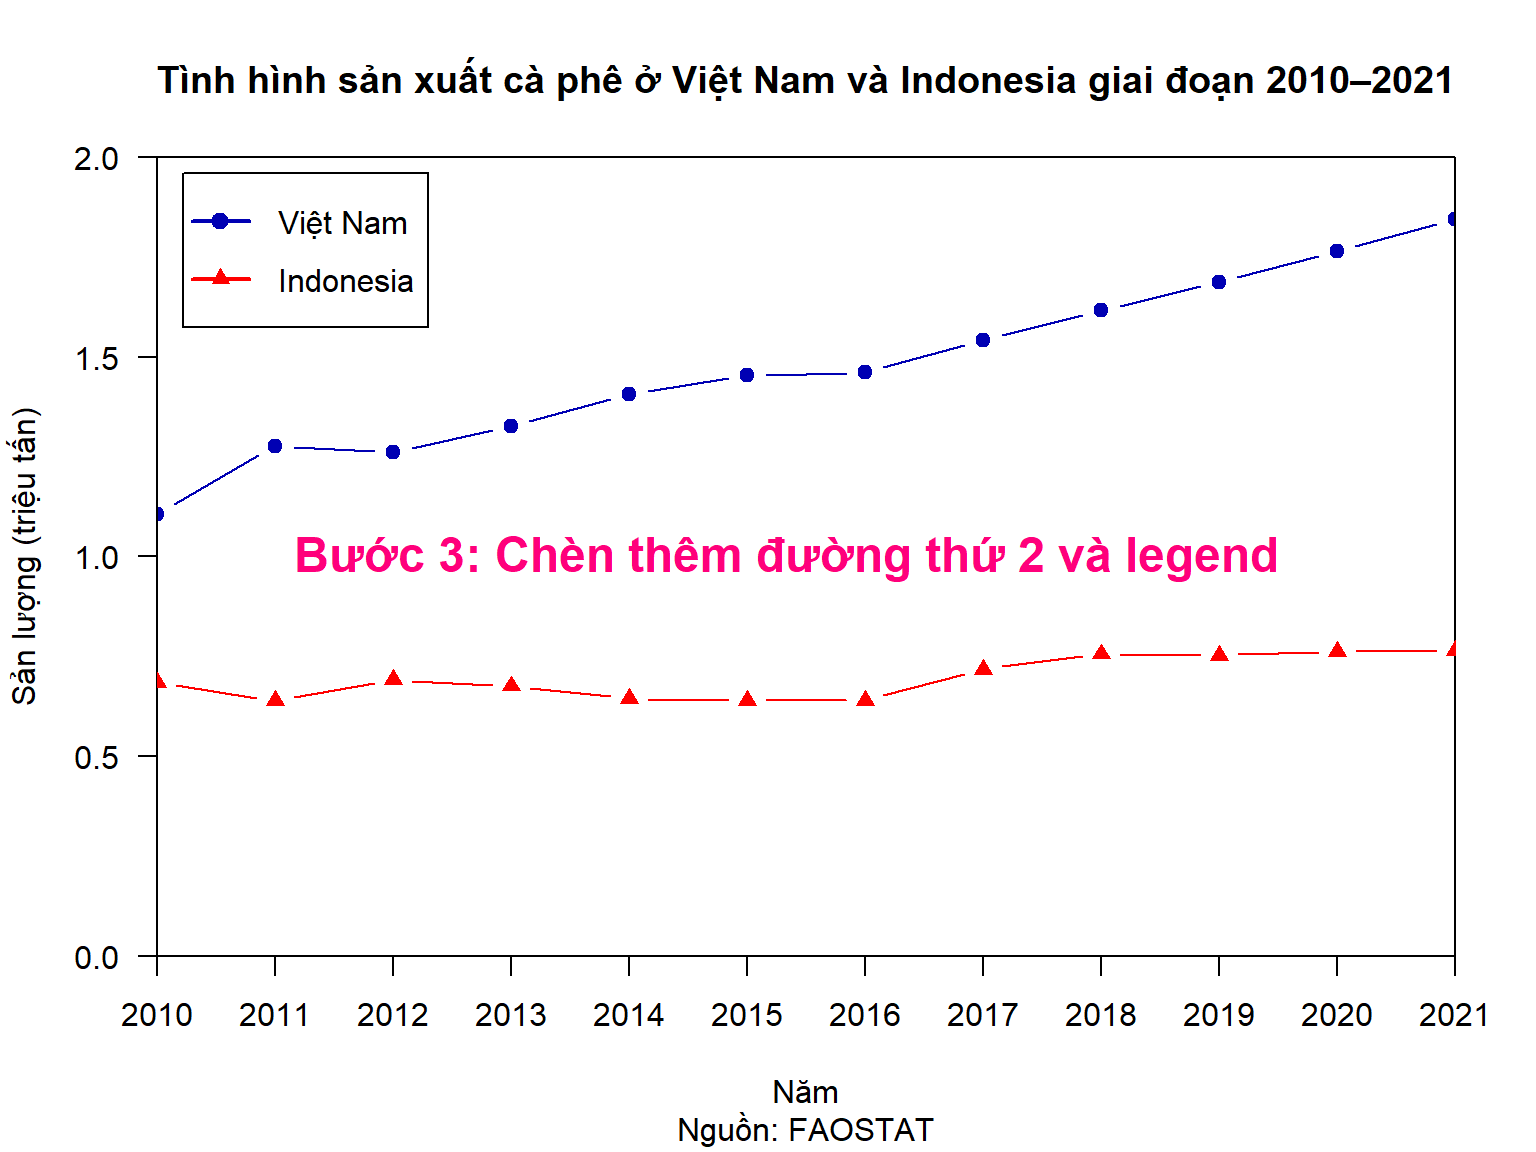
## dataset coffee_indo_2010_2021
points(production ~ year,
     data = coffee_indo_2010_2021,
     col = "red",
     pch = 17,
     type = "b"
     )

# Changing x axis

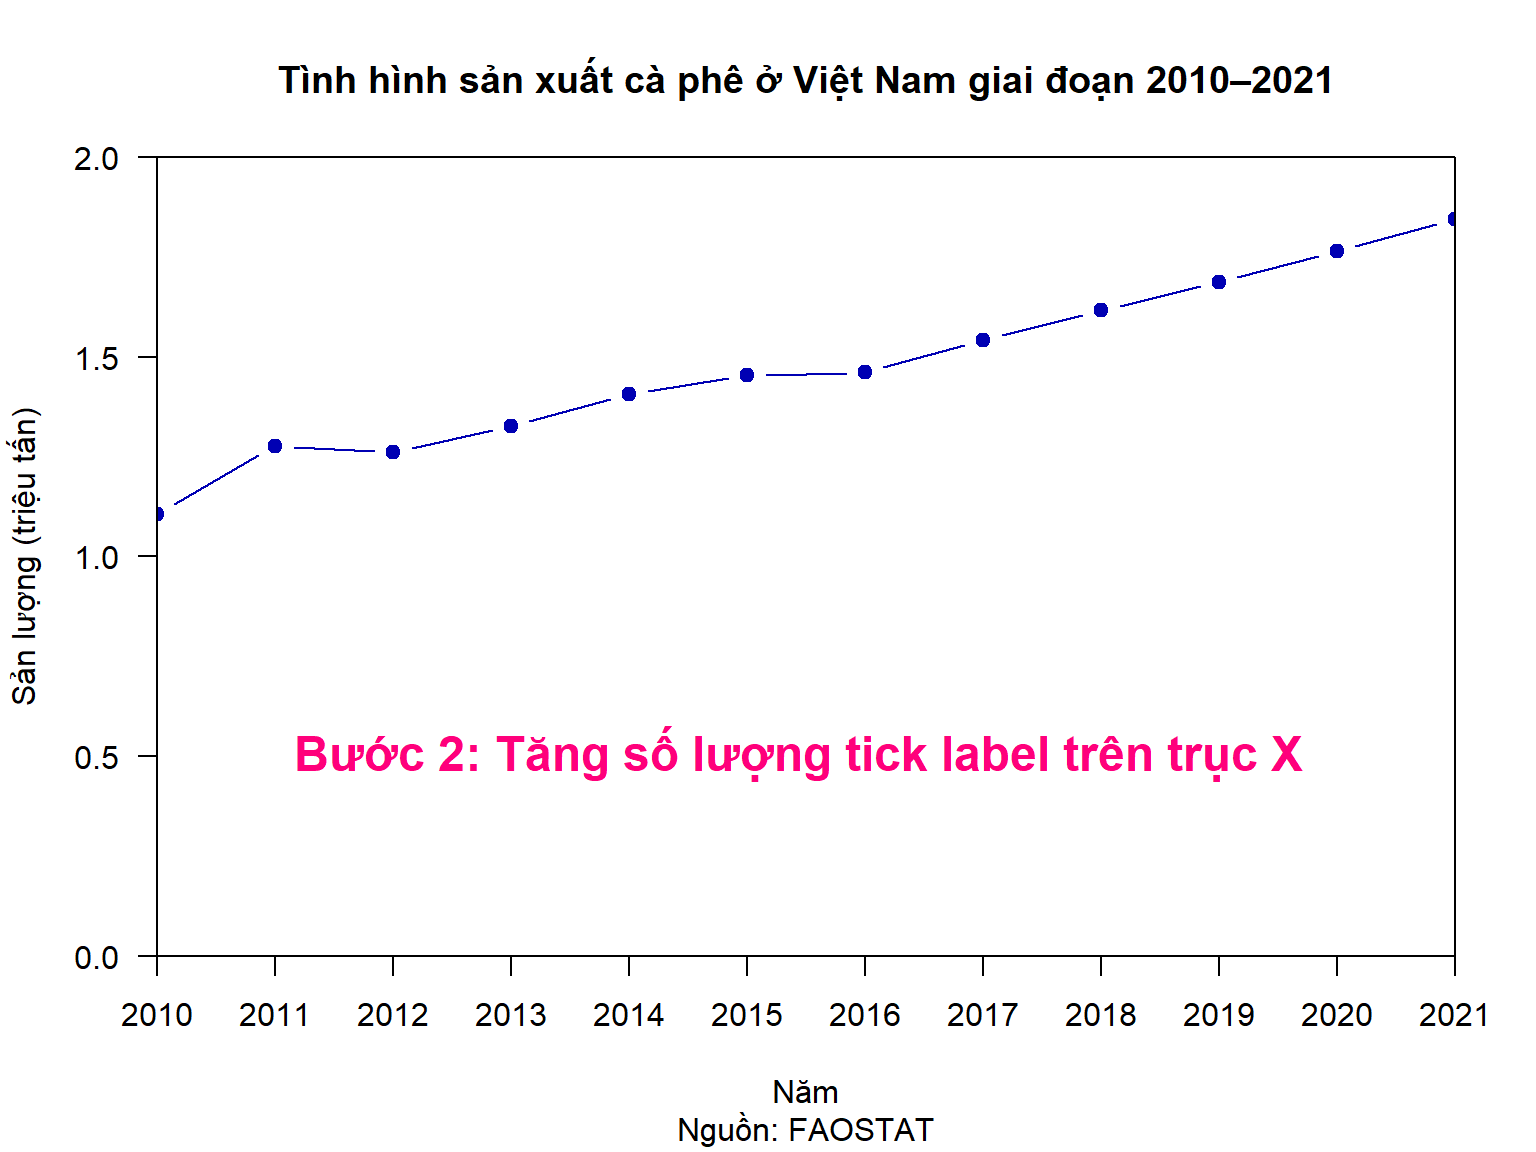
xtick <- seq(from = 2009, to = 2022, by = 1) # x tick label
xtick[1] <- ""
xtick[14] <- ""

axis(side = 1, at = xtick, labels = FALSE) # vẽ trục x (side = 1)

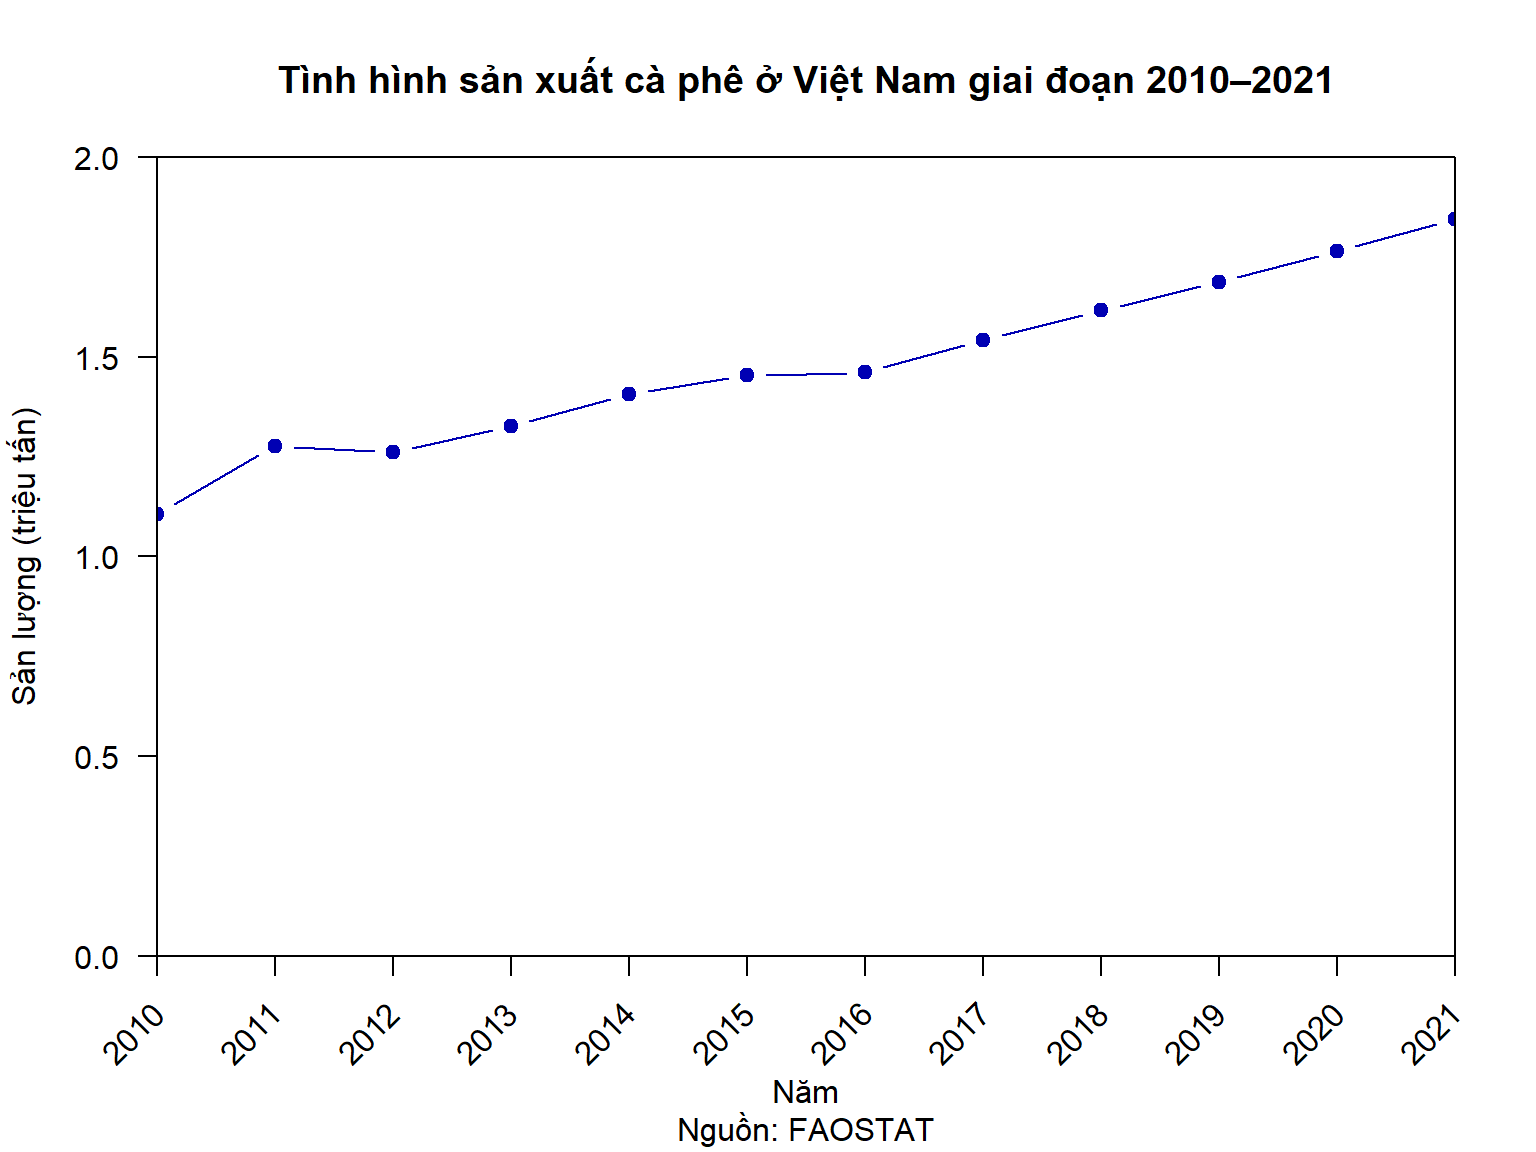
text(x = xtick,
     y = par("usr")[3],
     labels = xtick,
     srt = 0,
     # pos = 1,
     adj = c(0.5, 3),
     xpd = TRUE,
     family = "font_1")

# Thay đổi vị trí title

title(main = "Tình hình sản xuất cà phê ở Việt Nam và Indonesia giai đoạn 2010–2021",
      line = 3,
      family = "font_1")

# legend

par(family = "font_1")

legend(x = (2022 + 2009) / 2,
       y = 2.05,
       legend = c("Việt Nam", "Indonesia"),
       col = c("#0000b3", "red"),
       lty = c(1, 1),
       cex = 1,
       pt.cex = 1, # cex của point
       pch = c(19, 17),
       lwd = 2,
       x.intersp = 2.5,
       # y.intersp = 1,
       xjust = 0.5,
       yjust = 0,
       box.lty = 0,
       horiz = TRUE,
       xpd = TRUE,
       adj = c(0.4, 0.5), # chỉnh text legend
       seg.len = 3,
       merge = TRUE # gộp pch và line
       )

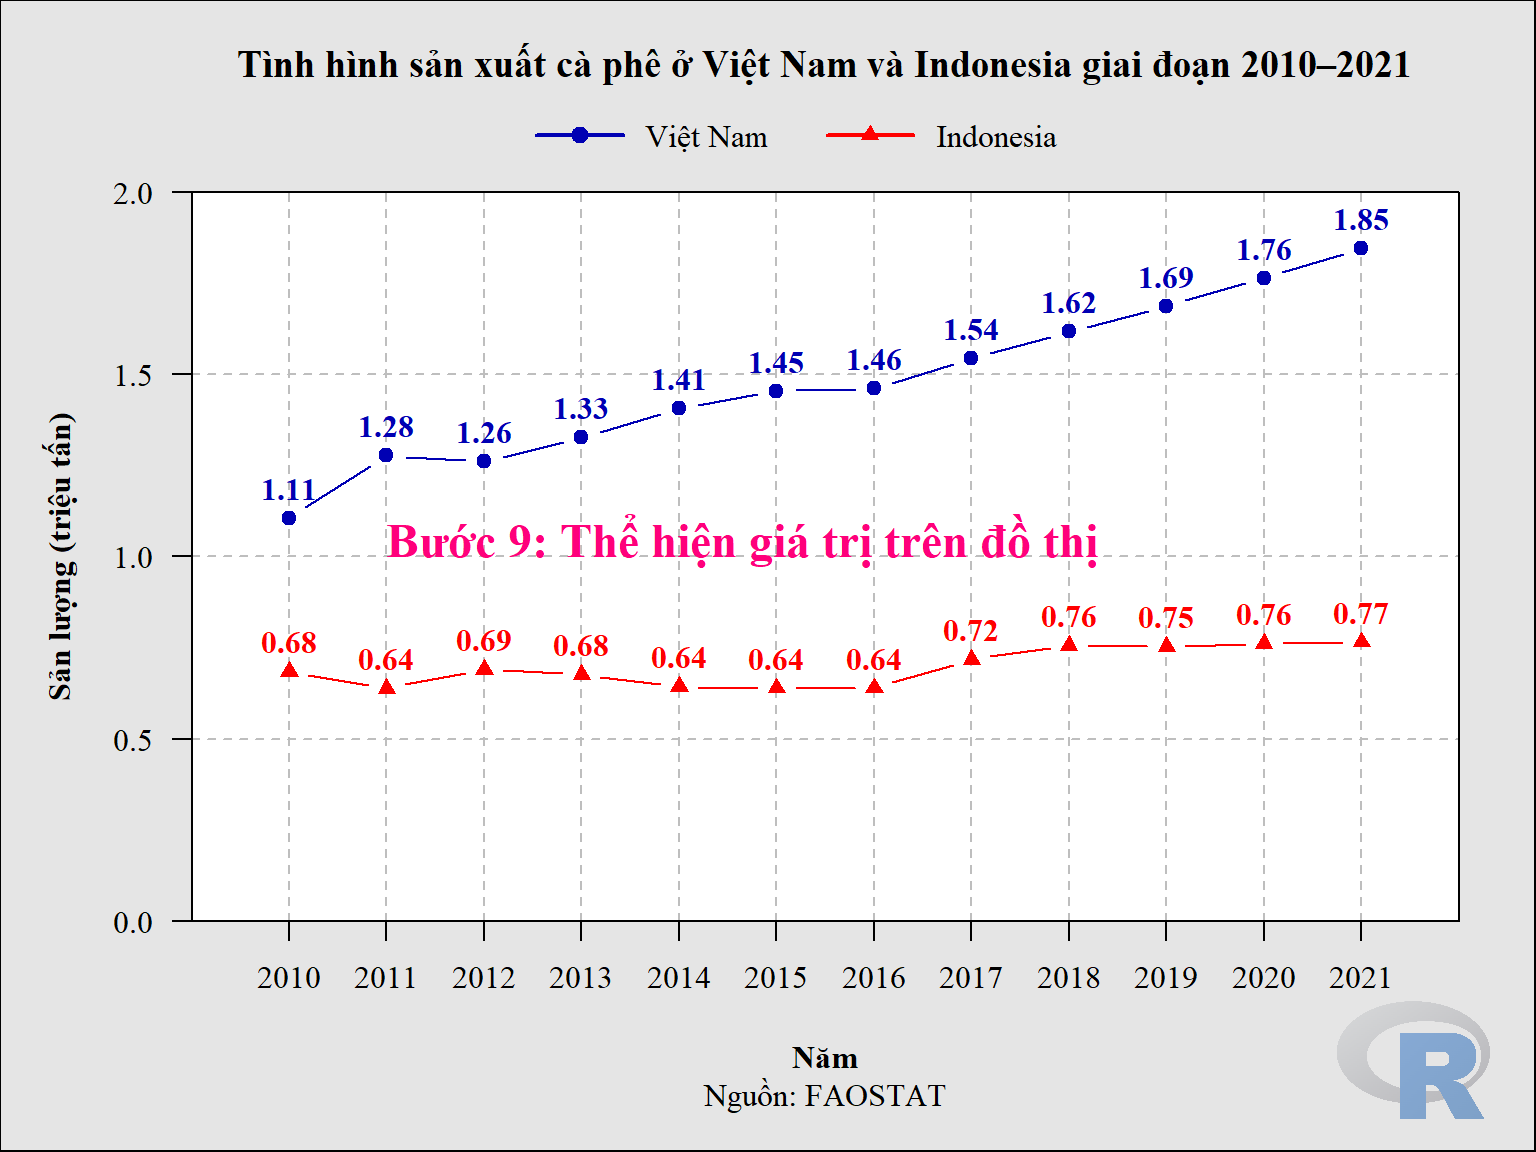
text(x = 2011,
     y = 1,
     labels = "Bước 9: Thể hiện giá trị trên đồ thị",
     cex = 1.5,
     col = "#ff007b",
     font = 2,
     # pos = 4,
     adj = c(0, 0),
     family = "font_1")

###

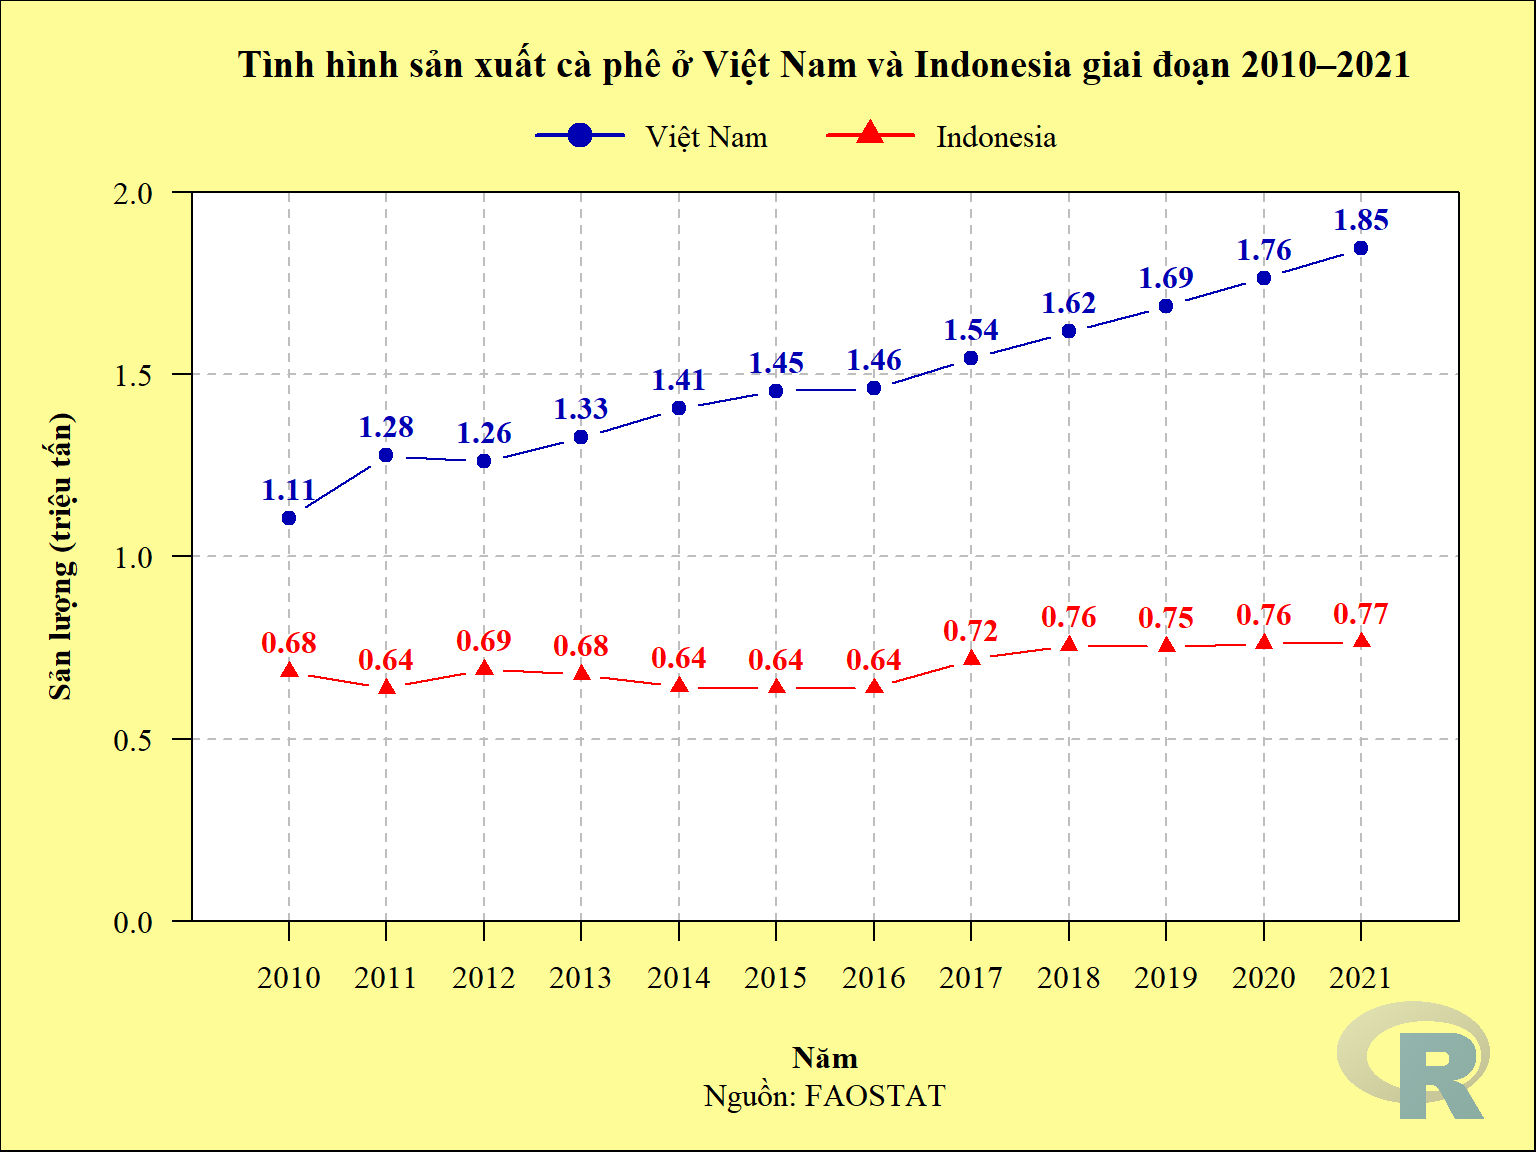
text(x = coffee_vn_2010_2021$year,
     y = coffee_vn_2010_2021$production,
     labels = round(coffee_vn_2010_2021$production, digits = 2),
     cex = 1,
     col = "#0000b3",
     font = 2,
     pos = 3,
     # adj = c(0, 0),
     family = "font_1")

text(x = coffee_indo_2010_2021$year,
     y = coffee_indo_2010_2021$production,
     labels = round(coffee_indo_2010_2021$production, digits = 2),
     cex = 1,
     col = "red",
     font = 2,
     pos = 3,
     # adj = c(0, 0),
     family = "font_1")

###

box(which = "plot")
box(which = "figure")
box(which = "outer")

library(png)
library(grid)
logor <- readPNG("logor.png")
grid.raster(logor, x = 0.92, y = 0.08, width = 0.1)